MICHA.ELMUELLER


OpenCityCamp 2012


The last two photos were shot by stk, who also wrote an article on the event.


To quote phil: “Isn’t it a little bit late to write about this?”. Yeah I know it is, I am just catching up with some stuff which I didn’t get around to write down so far.

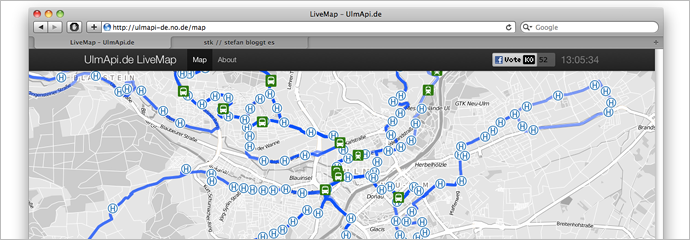
About 1.5 years ago we founded the datalove group at university. In the meantime members of the group have met up with people from the city, created some projects and even participated in consultations with government representatives. datalove fellow stk has even participated in the writing of a book. The LiveMap, which we did create last year, has been shown at the CeBIT ’12 as part of OpenData initiatives within Germany.

In May our efforts culminated in the organization of a BarCamp around Open Data. One week before the BarCamp Benjamin and I were guests in the local radio program “Plattform” at Radio Free FM. We talked about Open Data in general, Open Data within Ulm and about the OpenCityCamp. The recording of the show is online and can be found here (in German).

The BarCamp itself was pretty interesting. We managed to get a pretty decent sponsoring which resulted in awesome Catering and a really nice event. We didn’t really know if people would show up to give a presentation, but in the end everything went fine. We were able to have two parallel sessions most of the time. The whole event had about 50-60 participants.

There were several things we did, which I haven’t seen on other BarCamps. Most notably: Etherpads for each session. Nowadays you can most certainly say that within each session of a BarCamp there is probably at least one person with a laptop. People attending the sessions started to note opinions, interesting stuff, links and questions there. This worked pretty good! Even now you can look the pads up (here).

Second most notably: Hanging a huge plain sheet of paper at the wall, so that people could note their thoughts there.

The whole event took place in the university. This enabled us to use the equipment there (to spontaneously bake apple pie for example :)).

The BarCamp was also a good opportunity for some people to push the development of a local Freifunk community. Visit http://ulm.freifunk.net for more information on that.

Node.js Knockout: 48hr Hackathon

Last weekend nearly 300 teams of up to 4 people participated in the global Node.js Knockout — a 48hr Hackathon. We had a team from Ulm participating: Stefan, Benjamin, Simon & myself.

We decided to create a website that visualizes public transportation movements from Ulm on a map.

What we did was to transform time tables into a digital format called GTFS (a format for public transportation schedules and related geographic data). The shape files (the route a bus takes) were scraped by faking HTTP requests to a public webservice. A parser then reads the GTFS files and transforms them into comfortable JavaScript objects (GeoJSON, etc.). This data is then used to generate a live map. The maps are done using Open Street Maps material with a custom Cloudmade style. The frontend was created using Leaflet, among other libraries.

Browser communication for “live” events is done using socket.io. Socket.io is a very clever project, what they basically do is to implement websockets so that they work everywhere. This cross-browser compatibility is done by using a variety of techniques like XHR long polling or flashsockets. socket.io enables you to have an asynchronous communication between client-server. This way you can build realtime webapps.

If you go to the website you see a visualization of the time tables. It is live in the sense that it is the exactly how the pdf time tables look. It is not realtime, however. We hope to replace the GTFS feed with a GTFS-Realtime feed one day.

The whole project was build using JavaScript as the only programming language.

Further links:

GTFS Visualization from Ulm

Oh by the way: You can throw any GTFS data in there. Some cities (none from germany) have public data available (see list). The project can be used as a general way to visualize GTFS data. Just change the line var gtfsdir = "ulm"; in server.js. We tried Ontario and it worked like a charm, however if your files are too big you will have problems since V8 (the JavaScript engine under the hood of node.js) is currently limited to a fixed memory size of 2G. Also note that some cities don’t offer shape files.

Also notice: We didn’t get around to create GTFS data for the whole time table. So you don’t see every bus / tram on the map.

About Me

I am a 32 year old techno-creative enthusiast who lives and works in Berlin. In a previous life I studied computer science (more specifically Media Informatics) at the Ulm University in Germany.

I care about exploring ideas and developing new things. I like creating great stuff that I am passionate about.

License

All content is licensed under CC-BY 4.0 International (if not explicitly noted otherwise).
 
I would be happy to hear if my work gets used! Just drop me a mail.
 
The CC license above applies to all content on this site created by me. It does not apply to linked and sourced material.
 
http://www.mymailproject.de