MICHA.ELMUELLER


Exploring the ZEIT ONLINE API

The german weekly newspaper “DIE ZEIT” has an API available. This means it is easily possible for developers to use a lot of their data. Since they have made access to the data of nearly 400.000 articles since 1945 possible this is quite interesting (access to full texts is sadly missing, but a lot of other stuff is available). This post is about some of the interesting things I found whilst exploring the API.

My initial idea was to visualize how the ratio of articles with anglicisms evolved over time. At the moment this is too complex a project, due to the fact that getting the necessary data via the current API is difficult. However, I made some other interesting findings along the way.

The Wiktionary project provides a list of anglicisms (around 960 words) which I parsed out and used to search for articles concerning these words. This gave a list of how many matching articles on this word had been written each year since 1945. I also made an empty search to find out how many articles were created in total each year. These numbers could then be used to calculate the percentage of articles with anglicisms in each year.

Not all of the words provided interesting results but here is selection of some interesting ones. Please be aware that the statistics show a zoomed-in range. This is not a scale of 0-100%!

One should be very careful to interpret reasons for the peak just by looking at the visual representation. A potential reason might be the Gulf War in 1990–91 (the german translation is: “Golfkrieg”). Other causes worth investigating could be successes of german golf athletes or events around the VW Golf automobile.

Potential reasons for the peaks could be: in 1985 the Sinking of the Rainbow Warrior, in 1995 the Brent Spar protests and in 2010 the Deepwater Horizon.

The peak in 1987 could relate to the increased media coverage on aids. Also in 1987 the Institute for German Language (Gesellschaft für deutsche Sprache) chose “aids” has as the word of the year.

The peak in 1970 is most interesting to me, a potential cause could be the movement of 1968.

I have made the code used to gather the data and build the visualizations available under the MIT license via GitHub.
Node.js Knockout: 48hr Hackathon

Last weekend nearly 300 teams of up to 4 people participated in the global Node.js Knockout — a 48hr Hackathon. We had a team from Ulm participating: Stefan, Benjamin, Simon & myself.

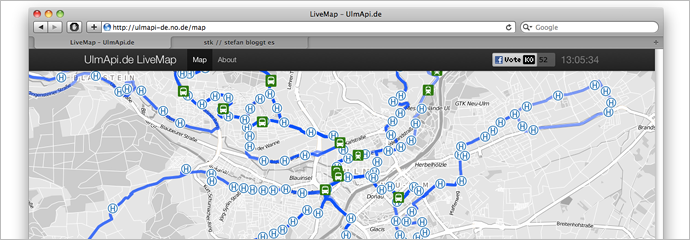
We decided to create a website that visualizes public transportation movements from Ulm on a map.

What we did was to transform time tables into a digital format called GTFS (a format for public transportation schedules and related geographic data). The shape files (the route a bus takes) were scraped by faking HTTP requests to a public webservice. A parser then reads the GTFS files and transforms them into comfortable JavaScript objects (GeoJSON, etc.). This data is then used to generate a live map. The maps are done using Open Street Maps material with a custom Cloudmade style. The frontend was created using Leaflet, among other libraries.

Browser communication for “live” events is done using socket.io. Socket.io is a very clever project, what they basically do is to implement websockets so that they work everywhere. This cross-browser compatibility is done by using a variety of techniques like XHR long polling or flashsockets. socket.io enables you to have an asynchronous communication between client-server. This way you can build realtime webapps.

If you go to the website you see a visualization of the time tables. It is live in the sense that it is the exactly how the pdf time tables look. It is not realtime, however. We hope to replace the GTFS feed with a GTFS-Realtime feed one day.

The whole project was build using JavaScript as the only programming language.

Further links:

GTFS Visualization from Ulm

Oh by the way: You can throw any GTFS data in there. Some cities (none from germany) have public data available (see list). The project can be used as a general way to visualize GTFS data. Just change the line var gtfsdir = "ulm"; in server.js. We tried Ontario and it worked like a charm, however if your files are too big you will have problems since V8 (the JavaScript engine under the hood of node.js) is currently limited to a fixed memory size of 2G. Also note that some cities don’t offer shape files.

Also notice: We didn’t get around to create GTFS data for the whole time table. So you don’t see every bus / tram on the map.

About Me

I am a 32 year old techno-creative enthusiast who lives and works in Berlin. In a previous life I studied computer science (more specifically Media Informatics) at the Ulm University in Germany.

I care about exploring ideas and developing new things. I like creating great stuff that I am passionate about.

License

All content is licensed under CC-BY 4.0 International (if not explicitly noted otherwise).
 
I would be happy to hear if my work gets used! Just drop me a mail.
 
The CC license above applies to all content on this site created by me. It does not apply to linked and sourced material.
 
http://www.mymailproject.de