Feb 3, 2019 0
Some Slack Apps I wrote in 2018
During my time at mbr I wrote a couple of Slack Apps which I included into the internal company channels.
I’m quite happy with the way they turned out and how actively they were used. They all contributed to the great company atmosphere — either in functional or entertaining ways.
Weekly interview with a random colleague
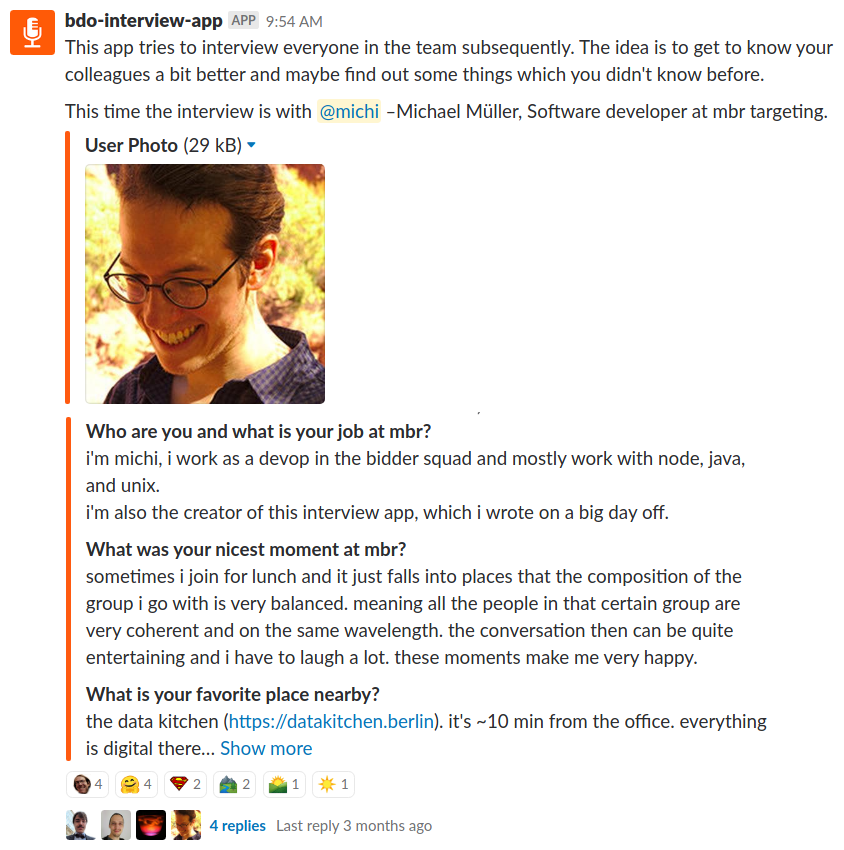
I wrote a Slack App which interviewed a different employee of the company each week. The questions were the same for everybody:
Hi there!
This app interviews everybody in the team subsequently. The idea is to get to know your colleagues a bit better and maybe find out some things which you didn’t know before. This time you have randomly been chosen to be interviewed.If you choose to answer the following questions, the answers will be posted for others to see.
These are the questions:
- Who are you and what is your job here?
- What was your nicest moment at mbr?
- What is your favorite place nearby?
- What was the last thing you discovered which excited you?
- What have you learned recently?
- When are you most productive?
- What was the last book/show/movie that you recommended to someone?
- My happy place is …?
The app offered the choice of answering the interview, skipping it this time, or skipping it forever.
Overall I am very happy with how it turned out. It’s one of the things I wrote of which I’m very proud. I would say the App was a success and it was always very interesting to read the interviews.
The team was only slightly de-centralized and I would imagine this to have even more benefit in a decentralized company where more people work remotely.
Bi-Weekly histogram of most used reactions
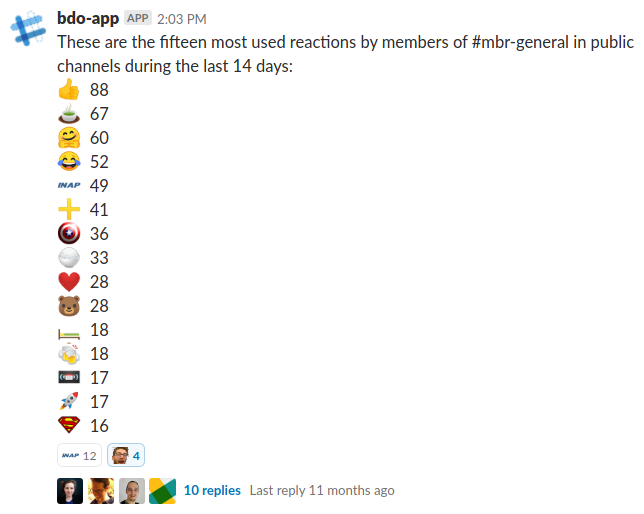
Slack offers the possibility of pinning emoji reactions to any message. This is (not only) a fun feature, but also reduces a lot of noise. Instead of “I agree”, “I join”, “Great idea!”, … people just pin a fitting emoji.
Each two weeks this integration posted a histogram of the recently most-used reactions. It was interesting and entertaining to watch how the reactions changed over time — e.g. during Christmas time or when there was some incident in the data center. The data center incidents were always clearly visible in the reactions :-).
Slack offers the possibility of creating custom emojis and Thomas had created an emoji for everybody with a photo of the person. So you could observe people showing up in the histogram, when they had e.g. achieved something nice. Or when somebody had a trademark thing that could be clearly attributed to her/him. We had also added a lot of logos as emojis — e.g. for the data center operator company. So whenever they caused chaos their logo was showing up high in the list.
I have put the script on GitHub.
Weekly histogram of on-call alarms issued by our monitoring system
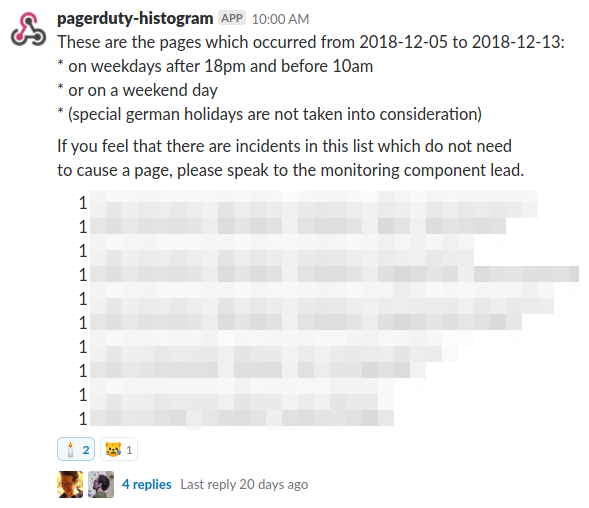
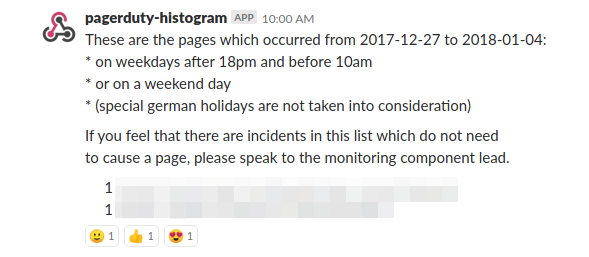
I was working as a DevOp and part of the job was to be on-call during nights, on weekends, etc.. This meant that whenever our monitoring system detected failures or anomalies the system would notify the person on-call; first with a push notification and then escalating further…up to a robot calling the person if he didn’t react at all. It was hard to keep track of the alarms which were raised, since the on-call shift was changing weekly. So I wrote this App which after every shift of a person would post the night and weekend alarms the person had to deal with.
This really helped improve awareness for the stack stability and the number of problems we had to deal with.
I would say that this definitely also had a huge impact on how the DevOps people were seen by non-DevOps colleagues. It raised awareness for stability issues and helped other people understand how much work being on-call was. It also offered a way for other people to show appreciation of how a person managed an incident (e.g. by talking to them, since this histogram was how they even found out that there was some incident in the first place).
After a while we started to explain the cause of the incidents in a thread below the post. This helped a lot communicating what was actually going on in the stack. We also later used these notes when discussing possible improvements and reflecting on what could have been prevented.
Oftentimes these histograms were the start of a longer discussion of how something could have been prevented with the whole team being involved. Before my integration this was something which only happened when there were major incidents, but not in this structured and holistic way.
I think this integration — simple as it may seem — was a big contribution to the company. The main take-away was that it made incidents visible, not only to the directly affected engineers.
Status information about active campaigns
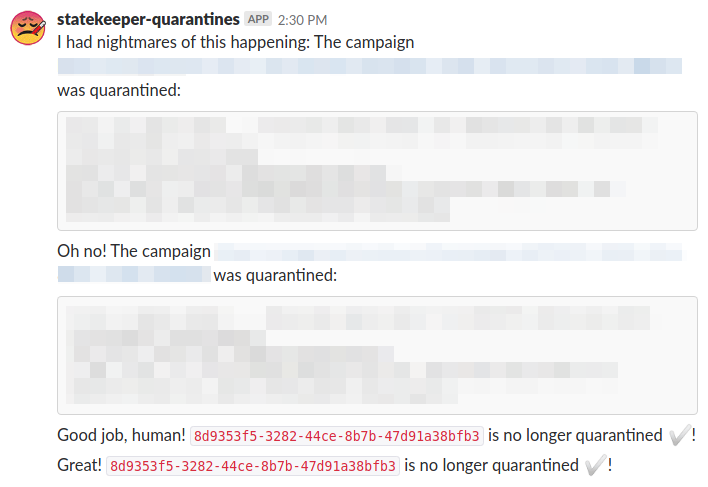
Another simple integration I wrote posted a notification whenever manual intervention was necessary into something running on the stack. The nice thing was that — since Slack offers threads — people were able to discuss the issue immediately in Slack and coordinate on who would take over.
I had fun playing with the messages and giving the App a bit of character. So the App would always choose a random message when alerting people about mishappennings or successful fixes.
