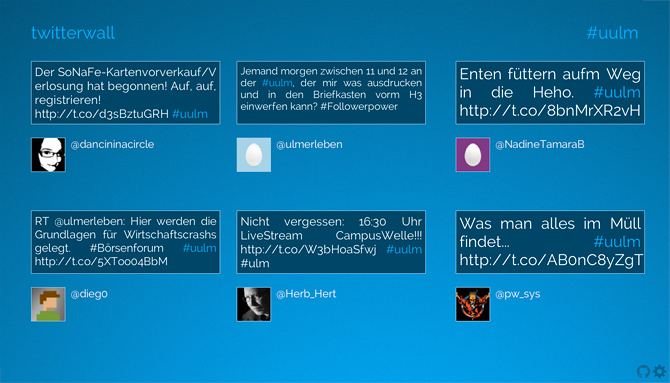
I have written a simple Twitterwall — a website which tracks tweets for a certain term. You can leave the website open and it will constantly show new tweets on the term you defined. This has proven to be quite a nice feature for events like BarCamps or other conferences. Setting up a beamer and displaying the Twitterwall in fullscreen is quite a nice feature for visitors who want to get a feeling for the conference mood or check on news.
Credit for the extrinisic motivation goes to Falco, who used the wall at the DEM 2013 and threatened to fork the project, if I wasn’t working on it. He also submitted a pull request for quite a nasty little bug. Last weekend we also used the wall at the OpenCityCamp. This brought up some issues, but I think I eventually figured them all out. The future will hold the answers.
However, the project is still in an early stage and quite simple in its functionalities. So far there is no possibility to track users/locations or show images, though I plan to add this over time. I have released the project under a free license on GitHub and as a package via npm (npm install twitterwall).
You can easily set up your own instance (further details in the readme) or you can use the public instance I have set up on http://twitterwall.creal.de.
Last weekend nearly 300 teams of up to 4 people participated in the global Node.js Knockout — a 48hr Hackathon. We had a team from Ulm participating: Stefan, Benjamin, Simon & myself.
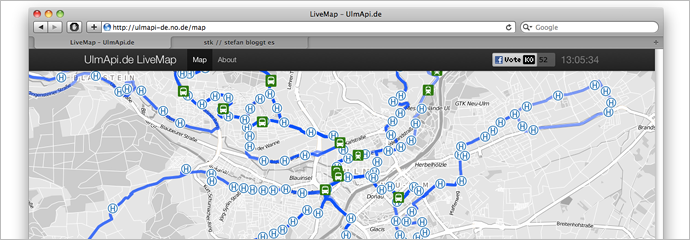
We decided to create a website that visualizes public transportation movements from Ulm on a map.
What we did was to transform time tables into a digital format called GTFS (a format for public transportation schedules and related geographic data). The shape files (the route a bus takes) were scraped by faking HTTP requests to a public webservice. A parser then reads the GTFS files and transforms them into comfortable JavaScript objects (GeoJSON, etc.). This data is then used to generate a live map. The maps are done using Open Street Maps material with a custom Cloudmade style. The frontend was created using Leaflet, among other libraries.
Browser communication for “live” events is done using socket.io. Socket.io is a very clever project, what they basically do is to implement websockets so that they work everywhere. This cross-browser compatibility is done by using a variety of techniques like XHR long polling or flashsockets. socket.io enables you to have an asynchronous communication between client-server. This way you can build realtime webapps.
If you go to the website you see a visualization of the time tables. It is live in the sense that it is the exactly how the pdf time tables look. It is not realtime, however. We hope to replace the GTFS feed with a GTFS-Realtime feed one day.
The whole project was build using JavaScript as the only programming language.
Further links:

Oh by the way: You can throw any GTFS data in there. Some cities (none from germany) have public data available (see list). The project can be used as a general way to visualize GTFS data. Just change the line var gtfsdir = "ulm"; in server.js. We tried Ontario and it worked like a charm, however if your files are too big you will have problems since V8 (the JavaScript engine under the hood of node.js) is currently limited to a fixed memory size of 2G. Also note that some cities don’t offer shape files.
Also notice: We didn’t get around to create GTFS data for the whole time table. So you don’t see every bus / tram on the map.


