Last weekend nearly 300 teams of up to 4 people participated in the global Node.js Knockout — a 48hr Hackathon. We had a team from Ulm participating: Stefan, Benjamin, Simon & myself.
We decided to create a website that visualizes public transportation movements from Ulm on a map.
What we did was to transform time tables into a digital format called GTFS (a format for public transportation schedules and related geographic data). The shape files (the route a bus takes) were scraped by faking HTTP requests to a public webservice. A parser then reads the GTFS files and transforms them into comfortable JavaScript objects (GeoJSON, etc.). This data is then used to generate a live map. The maps are done using Open Street Maps material with a custom Cloudmade style. The frontend was created using Leaflet, among other libraries.
Browser communication for “live” events is done using socket.io. Socket.io is a very clever project, what they basically do is to implement websockets so that they work everywhere. This cross-browser compatibility is done by using a variety of techniques like XHR long polling or flashsockets. socket.io enables you to have an asynchronous communication between client-server. This way you can build realtime webapps.
If you go to the website you see a visualization of the time tables. It is live in the sense that it is the exactly how the pdf time tables look. It is not realtime, however. We hope to replace the GTFS feed with a GTFS-Realtime feed one day.
The whole project was build using JavaScript as the only programming language.
Further links:

Oh by the way: You can throw any GTFS data in there. Some cities (none from germany) have public data available (see list). The project can be used as a general way to visualize GTFS data. Just change the line var gtfsdir = "ulm"; in server.js. We tried Ontario and it worked like a charm, however if your files are too big you will have problems since V8 (the JavaScript engine under the hood of node.js) is currently limited to a fixed memory size of 2G. Also note that some cities don’t offer shape files.
Also notice: We didn’t get around to create GTFS data for the whole time table. So you don’t see every bus / tram on the map.
After WikiLeaks released the diplomatic cables on 28. November 2010, several DNS services refused to resolve the domains. In the days and weeks after this incident about 2.200 mirror sites were set up by volunteers. This event shows how the decentralized structure of the internet was used to prevent censorship and depression.
The video shows a visualization of the wikileaks mirrors.
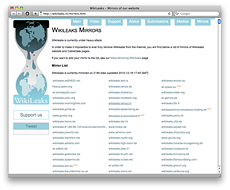 Finding all domains for the mirrors was not a problem, there are several sites listing adresses on a simple HTML page. This list can easily be parsed (for that task I used node.js). For resolving these domains to a WGS84 coordinate I used the same free GeoIP database as in the traceroute project. For more details on resolving domains to coordinates and mapping them on a globe see my last blog post (visualizing traceroute).
It is pretty interesting that the servers in fact are distributed over the whole world. Most of them are located — not really surprisingly — in Central Europe. But there are also some mirrors in China. Of course these results give no 100% exact location, but I think a tendency is clearly visible.
I’ve put together a little video of the global mirror distribution:
directlink to vimeo
Notice: This article was originally published on the blog ioexception.de (in german).
To get more familiar with Processing and OpenGL I wrote a graphical frontend for the Unix progarm traceroute. The output of traceroute is a list of stations a packet takes on it’s way through the network. This way network connection can easily be debugged, for example.
Technically this is realized with a “Time-To-Live”-field in the header of IP-packets. The TTL-entry describes after how many stations a packet should be discarded. Each router, which the packet passes, decrements this field. Once the TTL reaches 0 the packet is discarded and the sender gets notified with the ICMP-message TIME_EXCEEDED.
traceroute makes use of this and repeatedly sends packets to the destination host. The TTL gets incremented with each packet until the destination host is reached. The hosts on the route will give notice via ICMP-message. This way we will gather informations about the hosts and hopefully be able to identify the individual hosts on the route. The route may not be correct inevitably. There are several reasons for possible variations, e.g. firewalls often completely disable ICMP.
For the visualization I have tied traceroute to Processing. For further explanations on how to this see my blog post at ioexception.de. Though the post is in german the code will make things clear. It’s not really a complicated to do. The frontend reads the output of the command traceroute domain.org until EOF. Each line gets parsed and each individual host is resolved to an IP-address. Then a coordinate for this IP is assigned.
The coordinates can then — with some sin/cos magic — be mapped on a globe. Resolving IPs to a Geolocation is realized using a GeoIP database. GeoIP databases assign a coordinate for an IP with a certain probability and are not specifically 100% exact. But for our purpose this will do. There are some free suppliers and many commerical ones. I decided to give the free GeoLite City by Maxmind a go. This way we can resolve IP adresses to a WGS84 coordinate.
For the fronted I wrote a visualization in Java using the Processing API. The texture of the globe gets furthered rendered using a shader written in GLSL. Libraries I used: GLGraphics (OpenGL Rendering Engine for Processing), controlP5 (Button, Slider, Textfield) and toxiclibs (Interpolation & more numerical methods).
The source code is available under MIT on GitHub: visual-traceroute.
Some eye candy can be found within this video:
vimeo directlink.


