Jun 11, 2013 3
Visualizing “When do students submit assignments?”
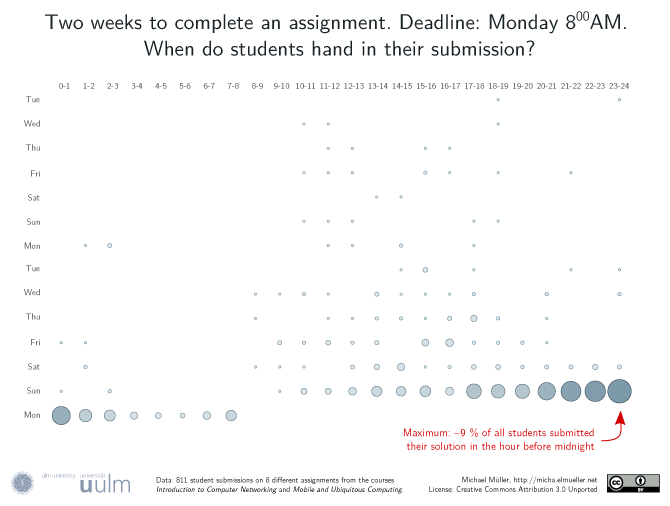
Last week Florian mentioned, that it is quite interesting to see when students submit their stuff for an assignment. I thought this was quite interesting. To answer this question visually, I used data from the courses “Introduction to Computer Networking” and “Mobile and Ubiquitous Computing”. Both courses had assignments over two weeks and a deadline set to Monday, 8:00 AM. The data consists of 811 submissions over a total of 8 assignments.
The data is exported from the ILIAS submission system. It is then parsed and an SVG is generated. The code I wrote therefore and the datasets are available via GitHub. After playing around with different styles and layouts I ended up with the above punchcard visualization (Benjamin deserves credit for bringing up the punchcard visualization idea).
It is interesting to see that students in fact submit stuff the whole night before a deadline. Interesting peaks are at midnight and between 7-8 AM. Especially the hours right before and after midnight are quite heavily frequented. To me, the most suprising fact was that students actually really do submit their stuff during the whole night :-).


